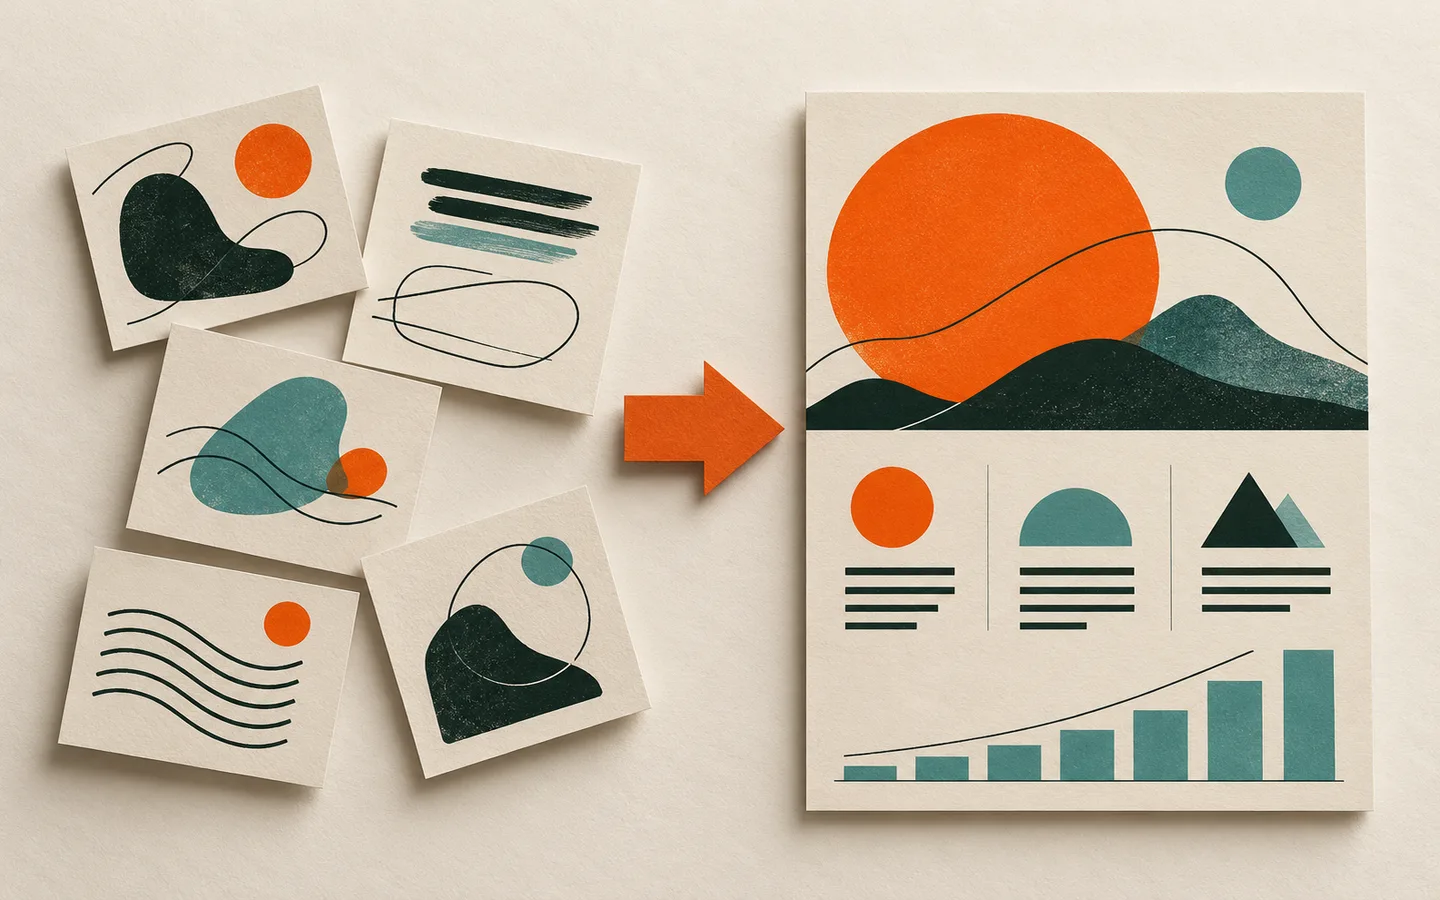

Start with a source sheet
Before asking for a visual, make a short source sheet: audience, central takeaway, verified facts, units, date ranges and links to the original evidence. If a number has no traceable source, label it as an estimate or leave it out.
Keep the source sheet beside the design. It makes review faster and prevents visually plausible details from becoming accidental facts.
Ask for structure, not a finished picture
Describe the sections and relationships you need: a comparison, a sequence, a hierarchy or a timeline. Specify which elements must remain editable—especially text, chart values and labels. A flattened preview is helpful for direction, but it should not be the only artifact.
Separate visual style from content requirements. That lets you change the palette or layout without regenerating factual information.
Audit every factual element
Read the infographic in two passes. First inspect all text, including small captions and labels. Then check every number, chart scale, arrow and relationship against the source sheet. A line pointing in the wrong direction can mislead even when all the words are correct.
- Check dates, units, percentages and denominators
- Make comparisons use consistent scales
- Keep caveats beside the claims they qualify
- Do not imply causation from correlation alone
Edit the hierarchy for humans
AI drafts often give too many items equal weight. Identify the one thing a reader should notice first, then group supporting details beneath it. Remove decorations that do not carry meaning.
Check contrast and legibility at the actual publication size, especially on mobile. The visual is not ready if its labels only work at full editor zoom.
A review example: a comparison chart
Imagine a generated graphic comparing three options by cost and speed. The bars look clear, but one option uses a monthly price and the others use annual totals. The design cannot fix that inconsistency by making the colors prettier. Normalize the data first, state the time period, then update both the chart and its caption.
Next check whether the visual scale makes a small difference look enormous. If the bars start above zero, explain why or choose a different encoding. Finally read the takeaway sentence against the corrected chart. It should say no more than the evidence supports.
A final publication pass
Ask someone else to identify the main claim, the source of the strongest number and any assumption they would want to challenge. If they cannot, the visual needs clearer labeling or a more honest caveat.
Keep a short record of where each figure came from and when it was checked. That record makes future updates safer and helps you correct an error without trying to reconstruct how the first version was made.
Avoid automation-shaped errors
Generated visuals can repeat a figure in several places, paraphrase a caveat too confidently or decorate a chart in a way that hides its scale. Check repeated facts in every location; correcting only the largest number is not enough.
Make the final review a separate step from aesthetic approval. Someone should be able to say the design looks compelling and still ask whether the comparison is fair, the labels are clear and the source is current. Those questions improve the work rather than slowing it down.