
Start with the information, not a blank canvas
Paste an outline, research notes or a rough idea. rabitmoon helps organize the hierarchy, choose an appropriate visual structure and place the first version on the canvas.
AI INFOGRAPHIC GENERATOR
Describe the story you want to tell and rabitmoon structures it into an editable visual document you can refine, present and export.
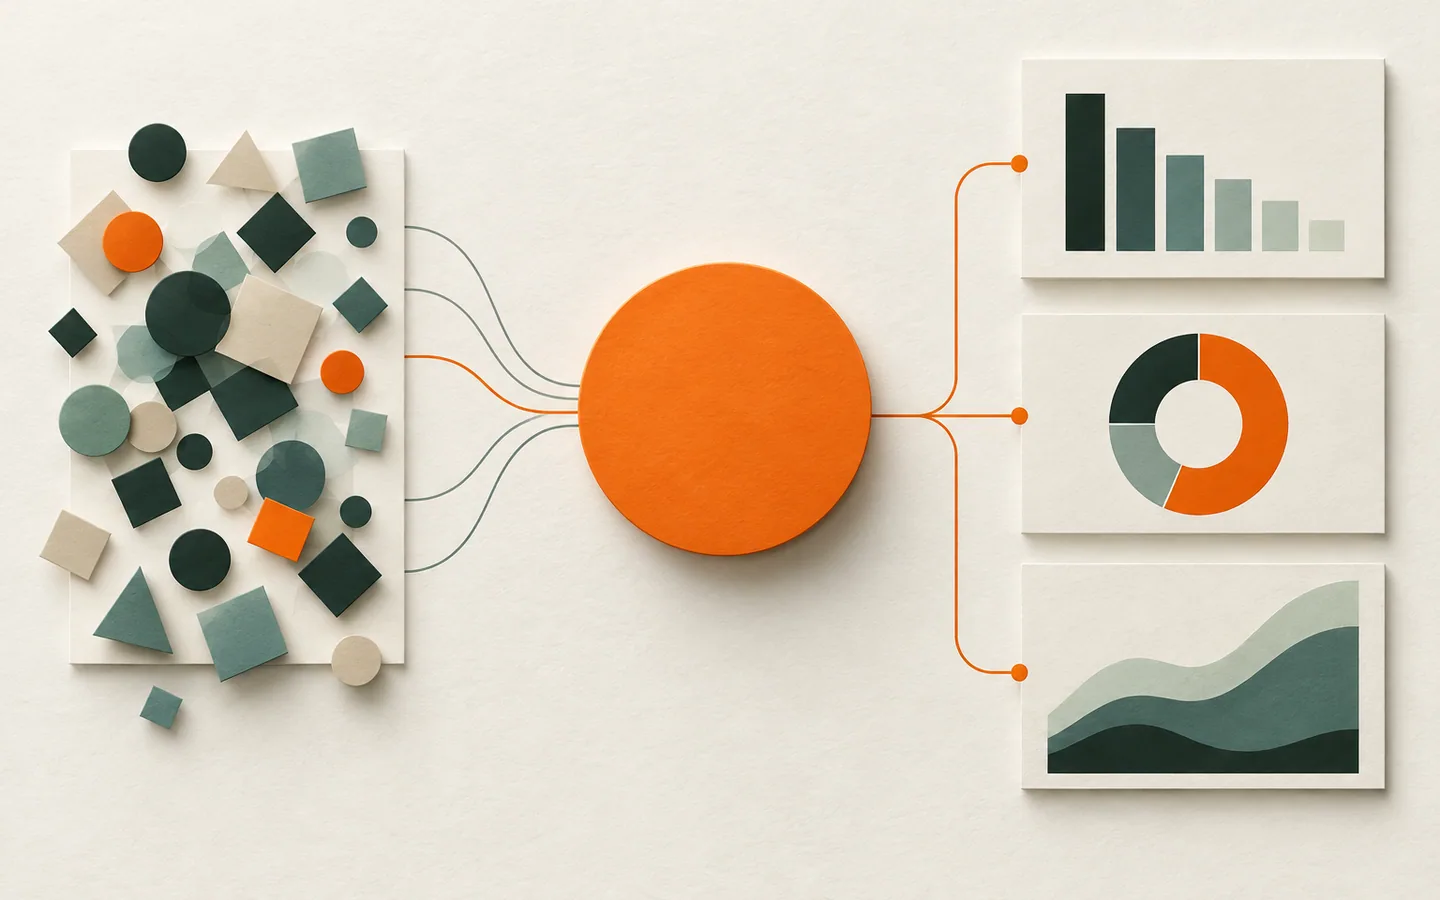
Paste an outline, research notes or a rough idea. rabitmoon helps organize the hierarchy, choose an appropriate visual structure and place the first version on the canvas.
The generated infographic remains editable. Change copy, colors, positions, charts and visual emphasis instead of accepting a flattened image.
Use the same workflow for processes, timelines, comparisons, statistics and executive summaries.
A timeline makes change visible; a comparison clarifies trade-offs; a process shows what happens next. Begin with the reader’s question, then give each section of the infographic a clear role.
Review claims, numbers, labels and chart scales against your sources. Inspect the exported visual at its real size so that headings, caveats and source notes remain readable.
REAL WORK
The illustration above introduces the idea. Here is an actual visual created with rabitmoon. Explore the example to see the result at full size and view any additional pages.
Read the guide: How to make an AI infographic editable and accurate ↗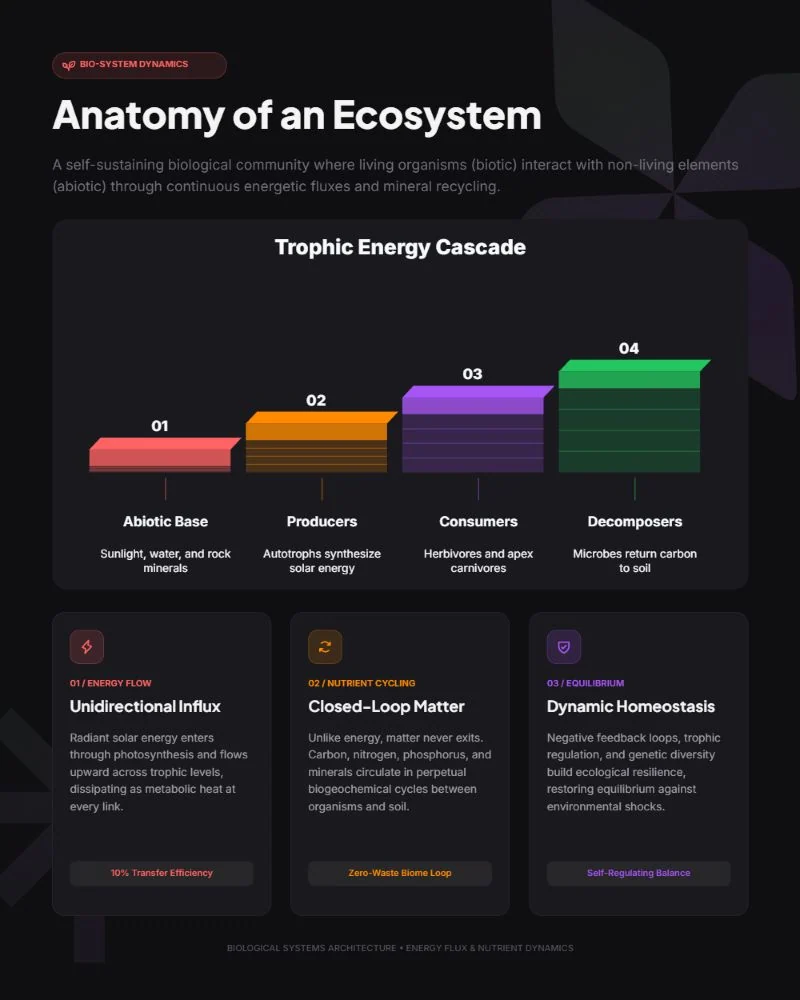
WORK WITH THE IDEA