
Describe the system in plain language
Start with components, actors, steps or dependencies. rabitmoon converts that description into a structured visual model.
AI DIAGRAM GENERATOR
Turn a written process, system description or relationship map into a diagram that can be inspected and refined.
Start with components, actors, steps or dependencies. rabitmoon converts that description into a structured visual model.
Create flowcharts, architecture diagrams, sequences, mind maps and other relationship-focused visuals.
Edit labels and structure as your understanding changes.
Set a clear start and end, keep the reading direction consistent and use active labels for steps. Put exceptions on branches rather than allowing them to obscure the common path.
Ask a reader to follow each decision without your explanation. Where they hesitate, simplify a label, untangle a connector or separate an overloaded system into an overview and a detailed view.
REAL WORK
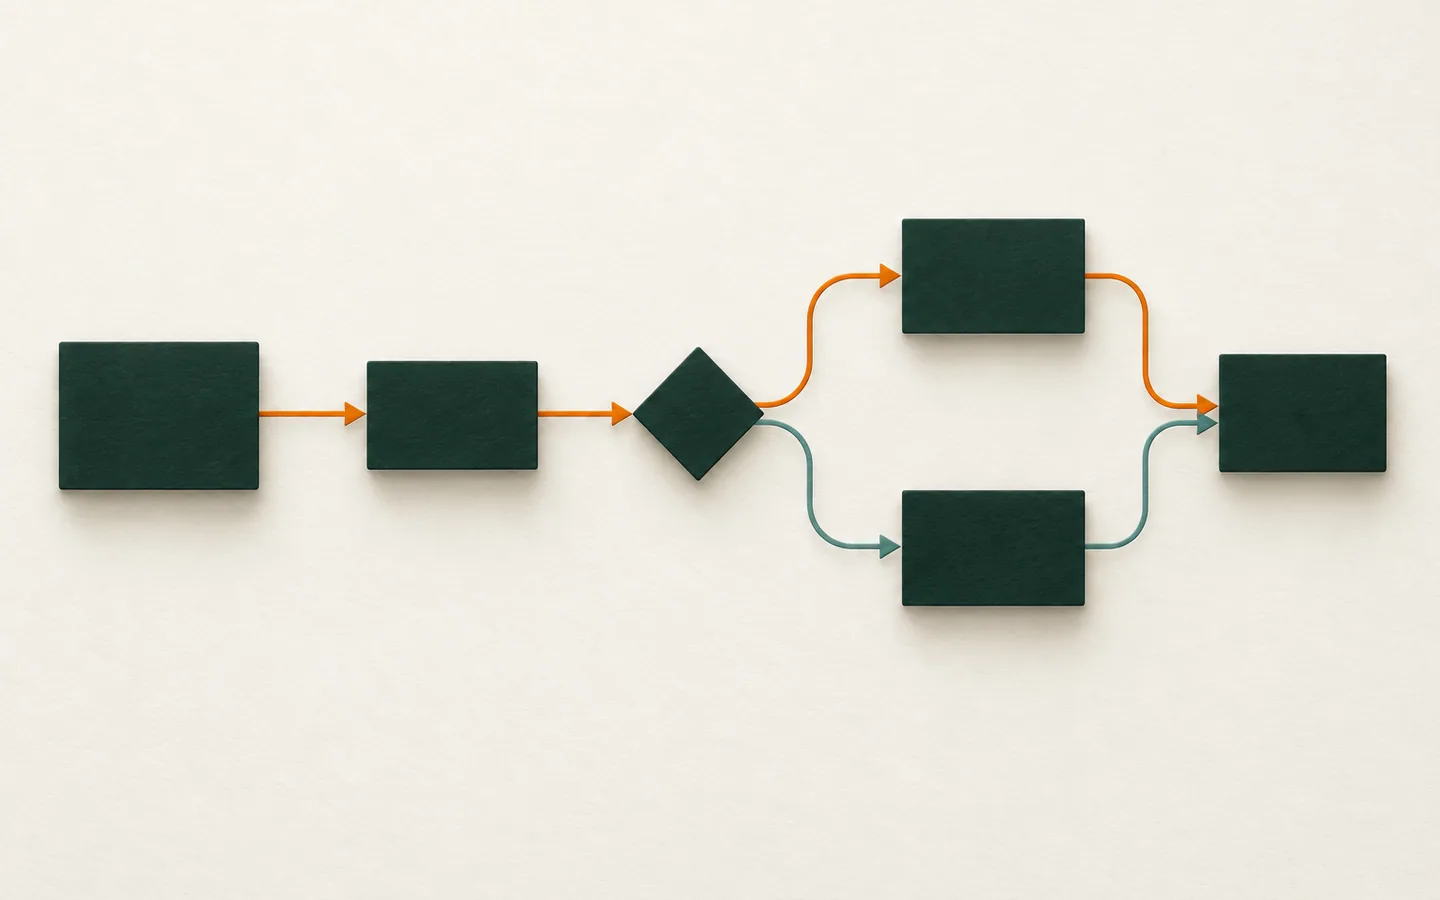
The illustration above introduces the idea. Here is an actual visual created with rabitmoon. Explore the example to see the result at full size and view any additional pages.
Read the guide: How to design a process diagram people can actually follow ↗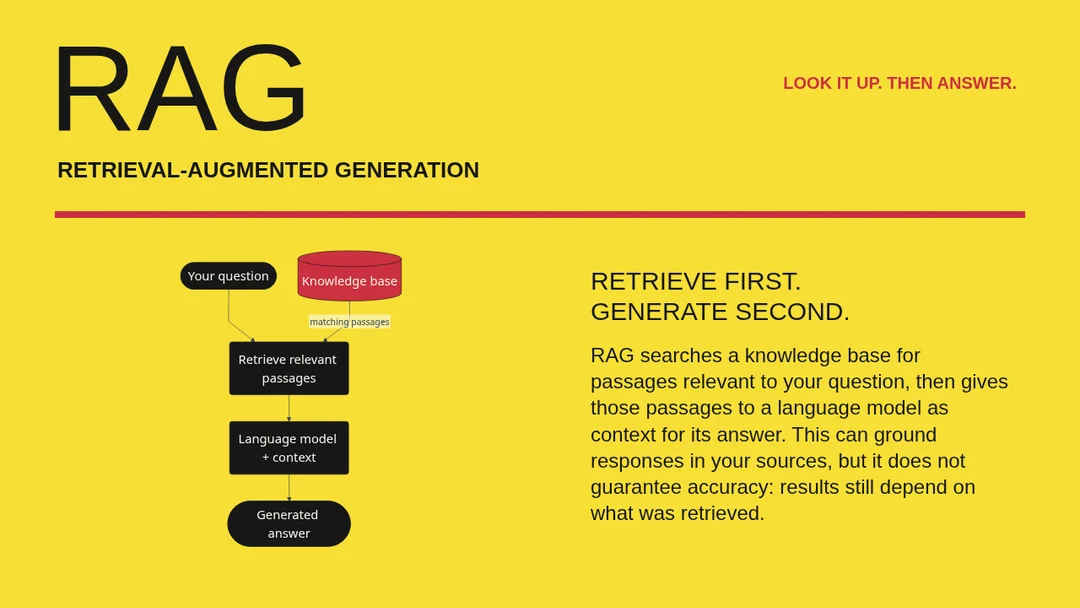
WORK WITH THE IDEA